HOWTO: Save Monitoring Data on the Command Line
To extract the application performance samples, use monextract all, which will create four comma-separated value files in ~/cbtool/data/<experiment_identifier>:
-
VM_management_<experiment id>.csv: contains information regarding the provisioning time, capture time, among others, all extracted directly from the cloud management system.
The R script ~/cbtool/util/plot/cbplotgen.R is quite experimental at this point. The dependencies for it are not part of the main CBTOOL installation at this point. They are basically:
- pdftk (in Ubuntu,
apt-get install pdftkis enough) - the following R libraries (it is recommended that you install these as root, from the R prompt): Here is an example of the data plotted from this file (all graphs are auto-generated with
~/cbtool/util/plot/cbplotgen.R, which is quite experimental at this point): install.packages("stringr"); install.packages("reshape2"); install.packages("ggplot2"); install.packages("data.table"); install.packages("xtable"); install.packages("sciplot")
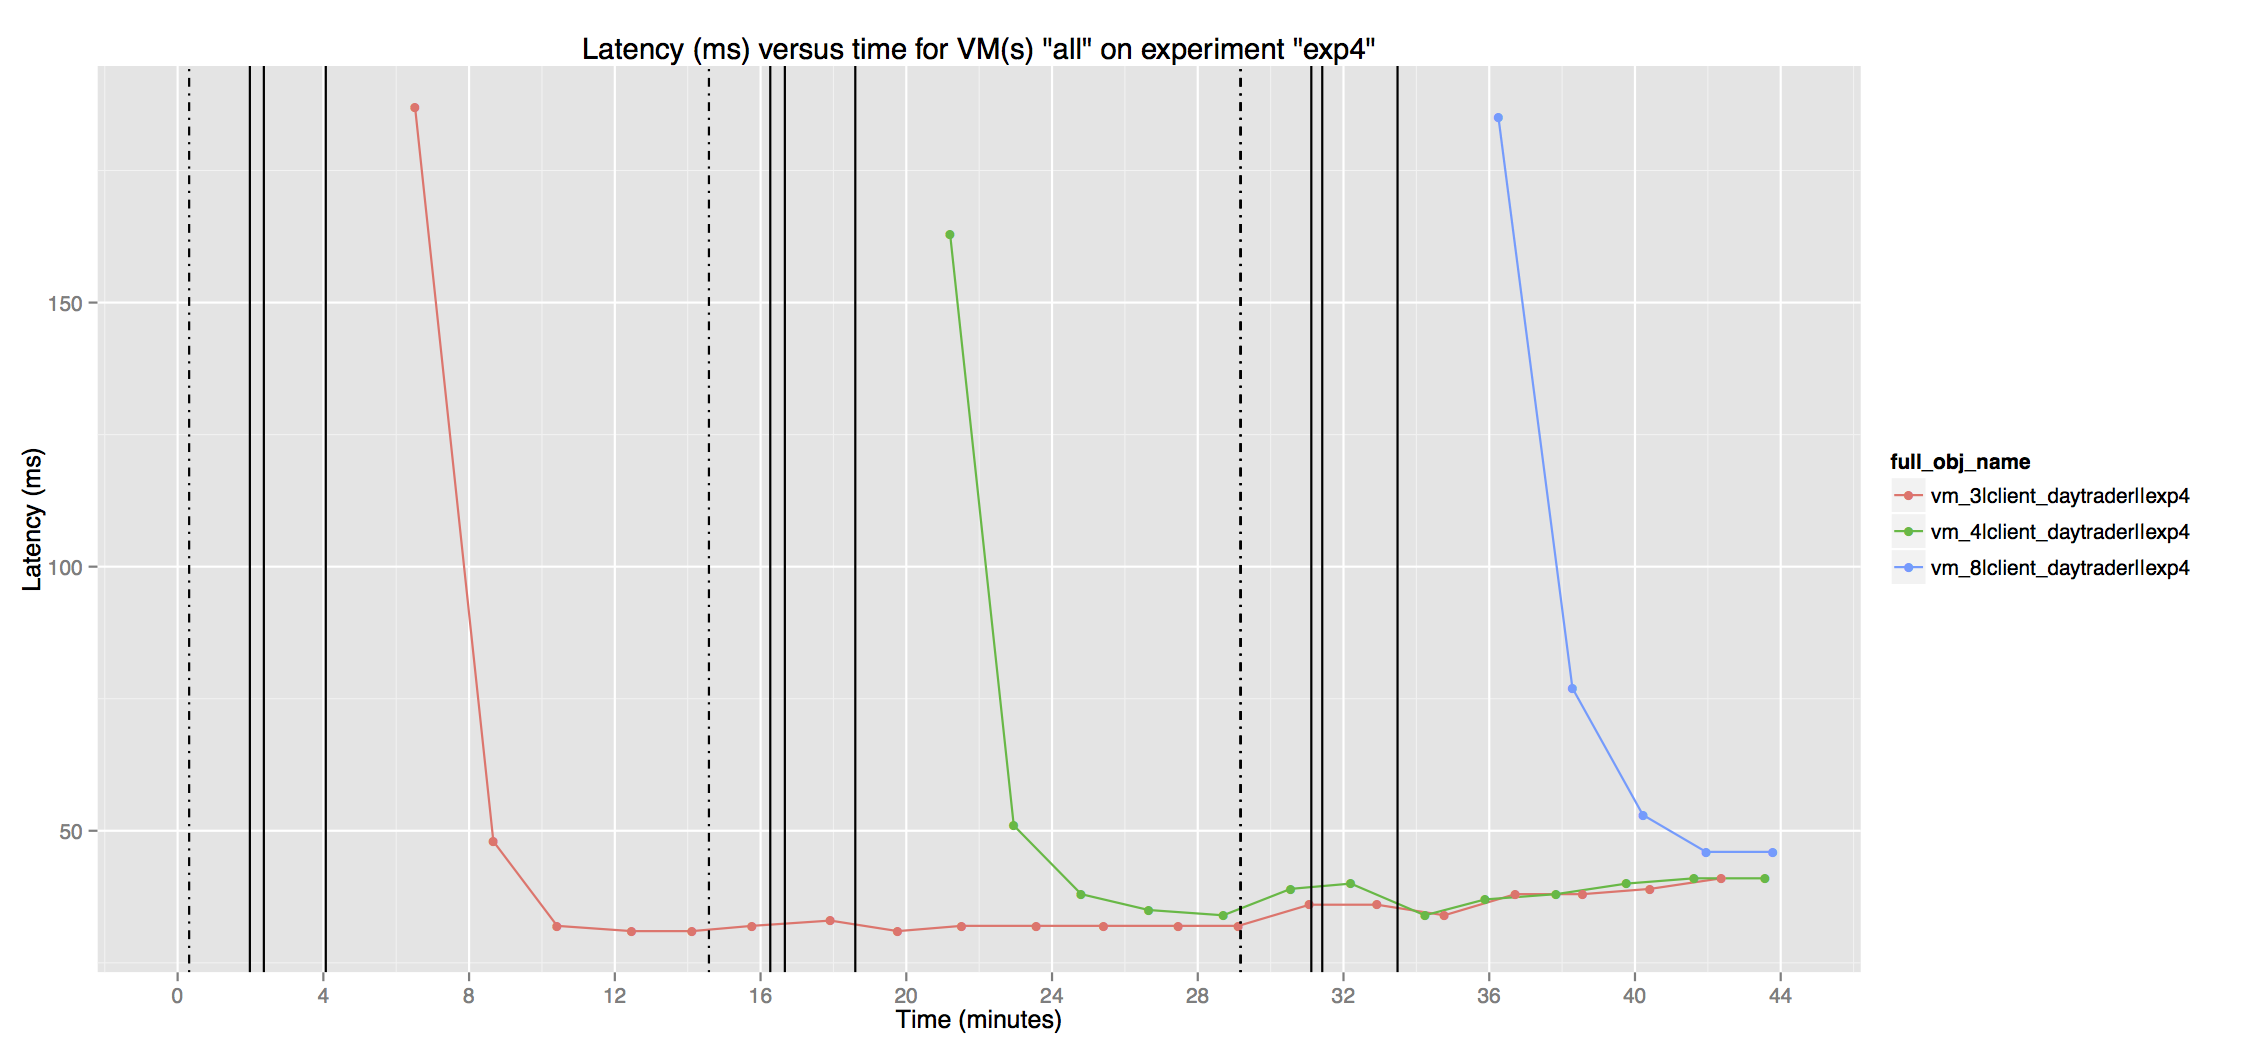
To use the tool (again, unlike the rest of CBTOOL, this tool is not part of any regular regression testing :-), just execute it with the appropriate parameters: ~/cbtool/util/plot/cbplotgen.R -d ~/cbtool/data -e <experiment_name> -c -p -r -l. The -p tells the tool to generate plots using provisioning performance data, the -r, to generate plots using application performance data, and the -l, to overlay provisioning events on the same time axis as the application performance data (useful to show the effect of provisioning on application performance). Check the full range of options by running the tool with the --help command line option.
Here are some example graphs generated with this tool:
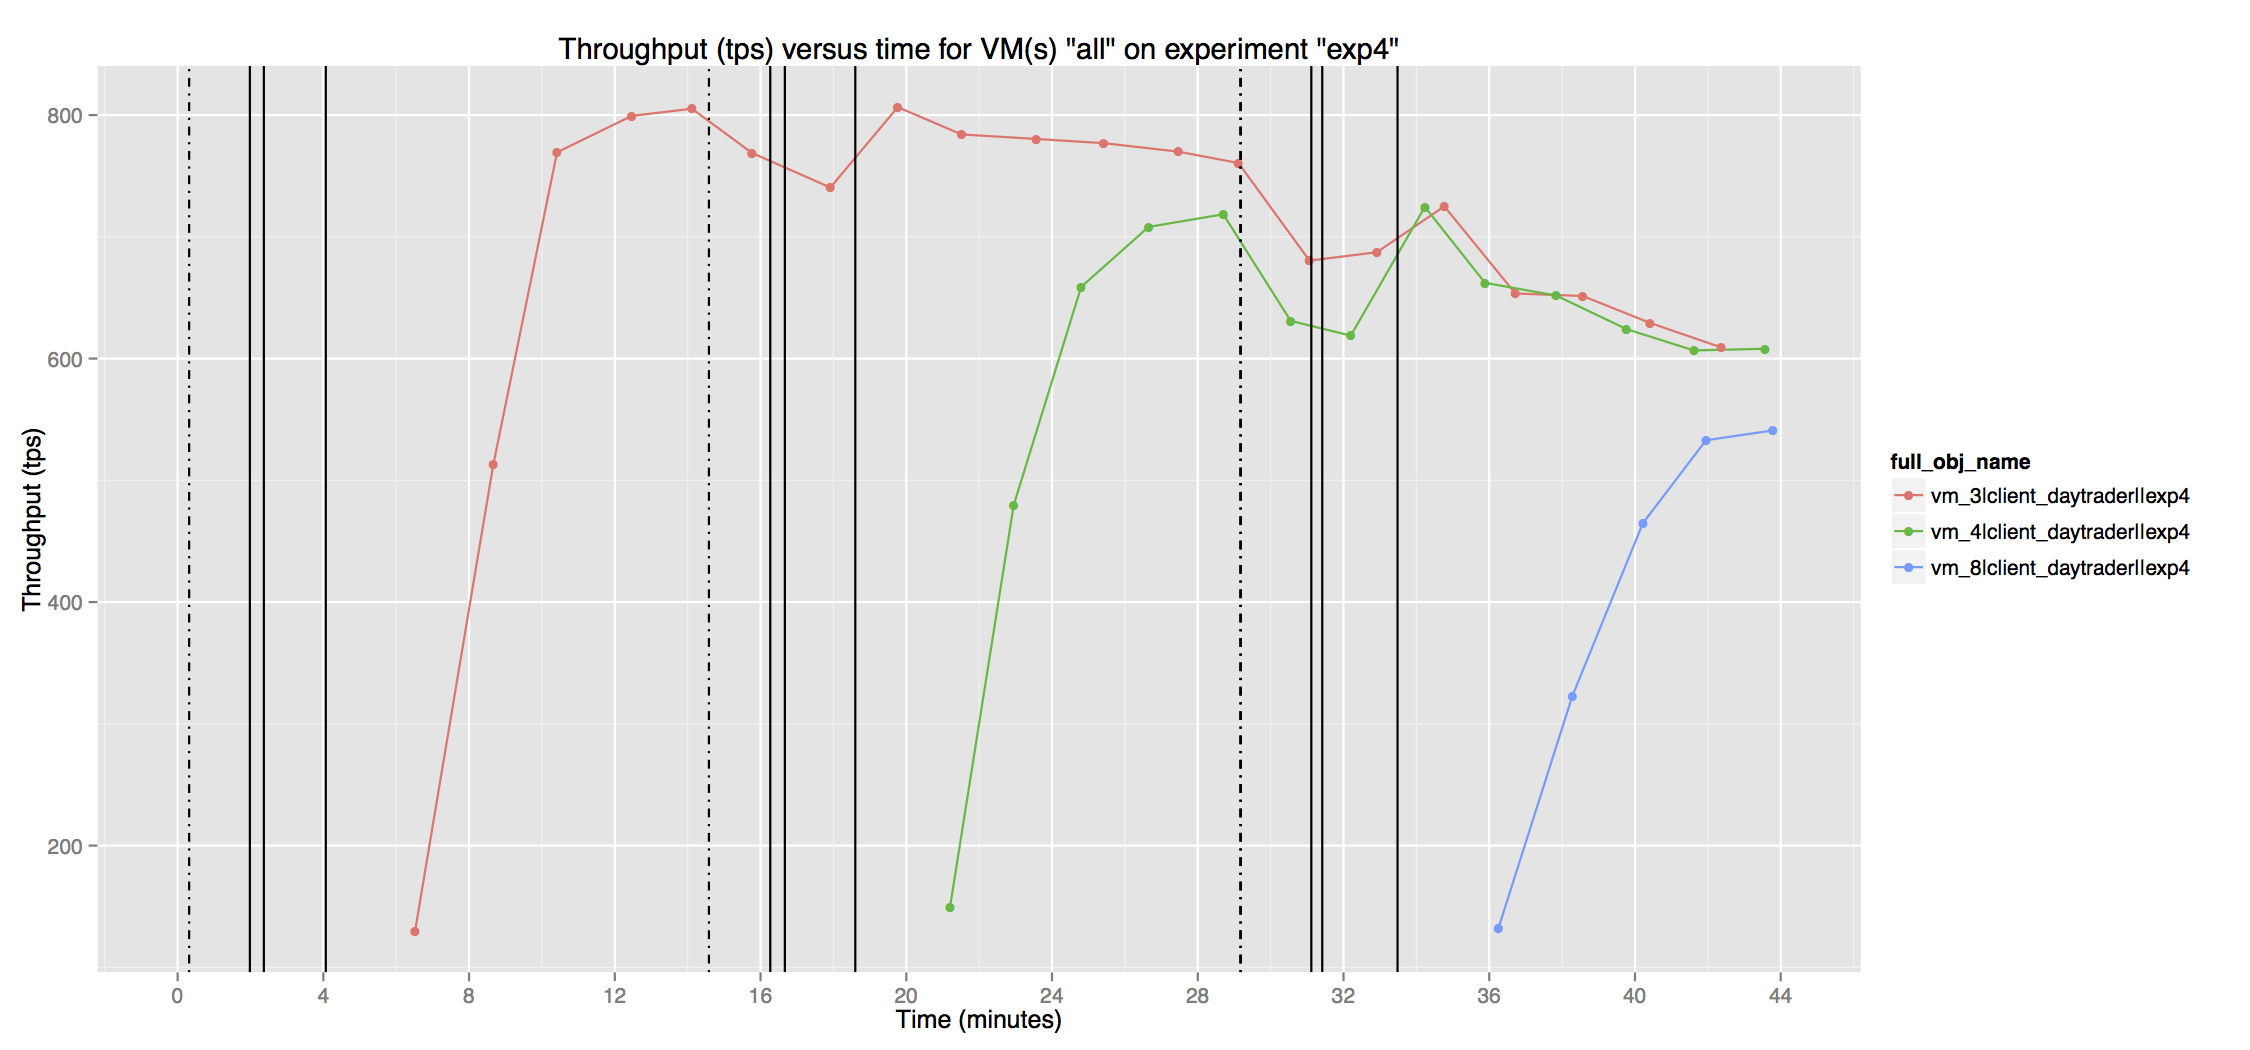
This first plot was generated as part of the Experiment 4
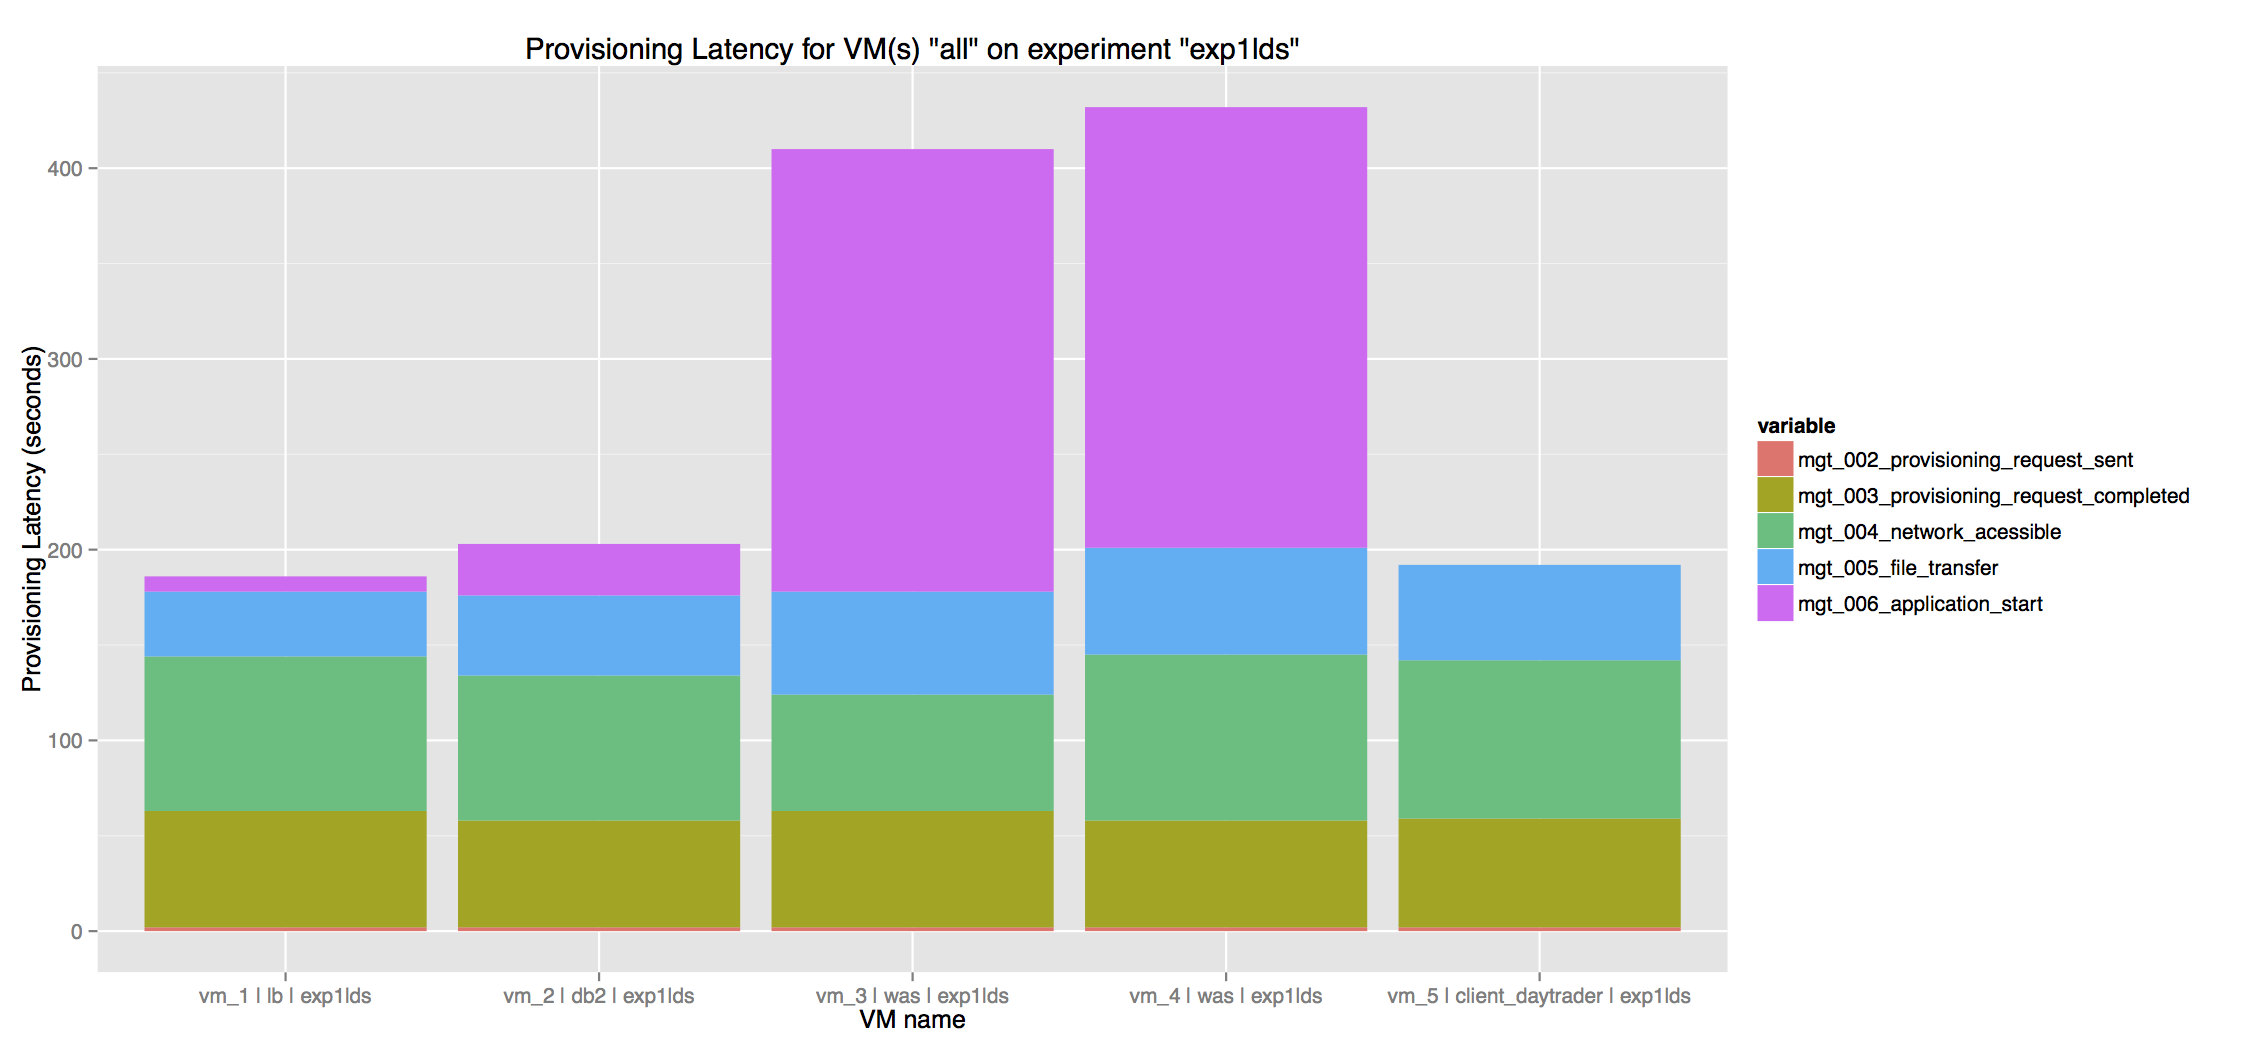
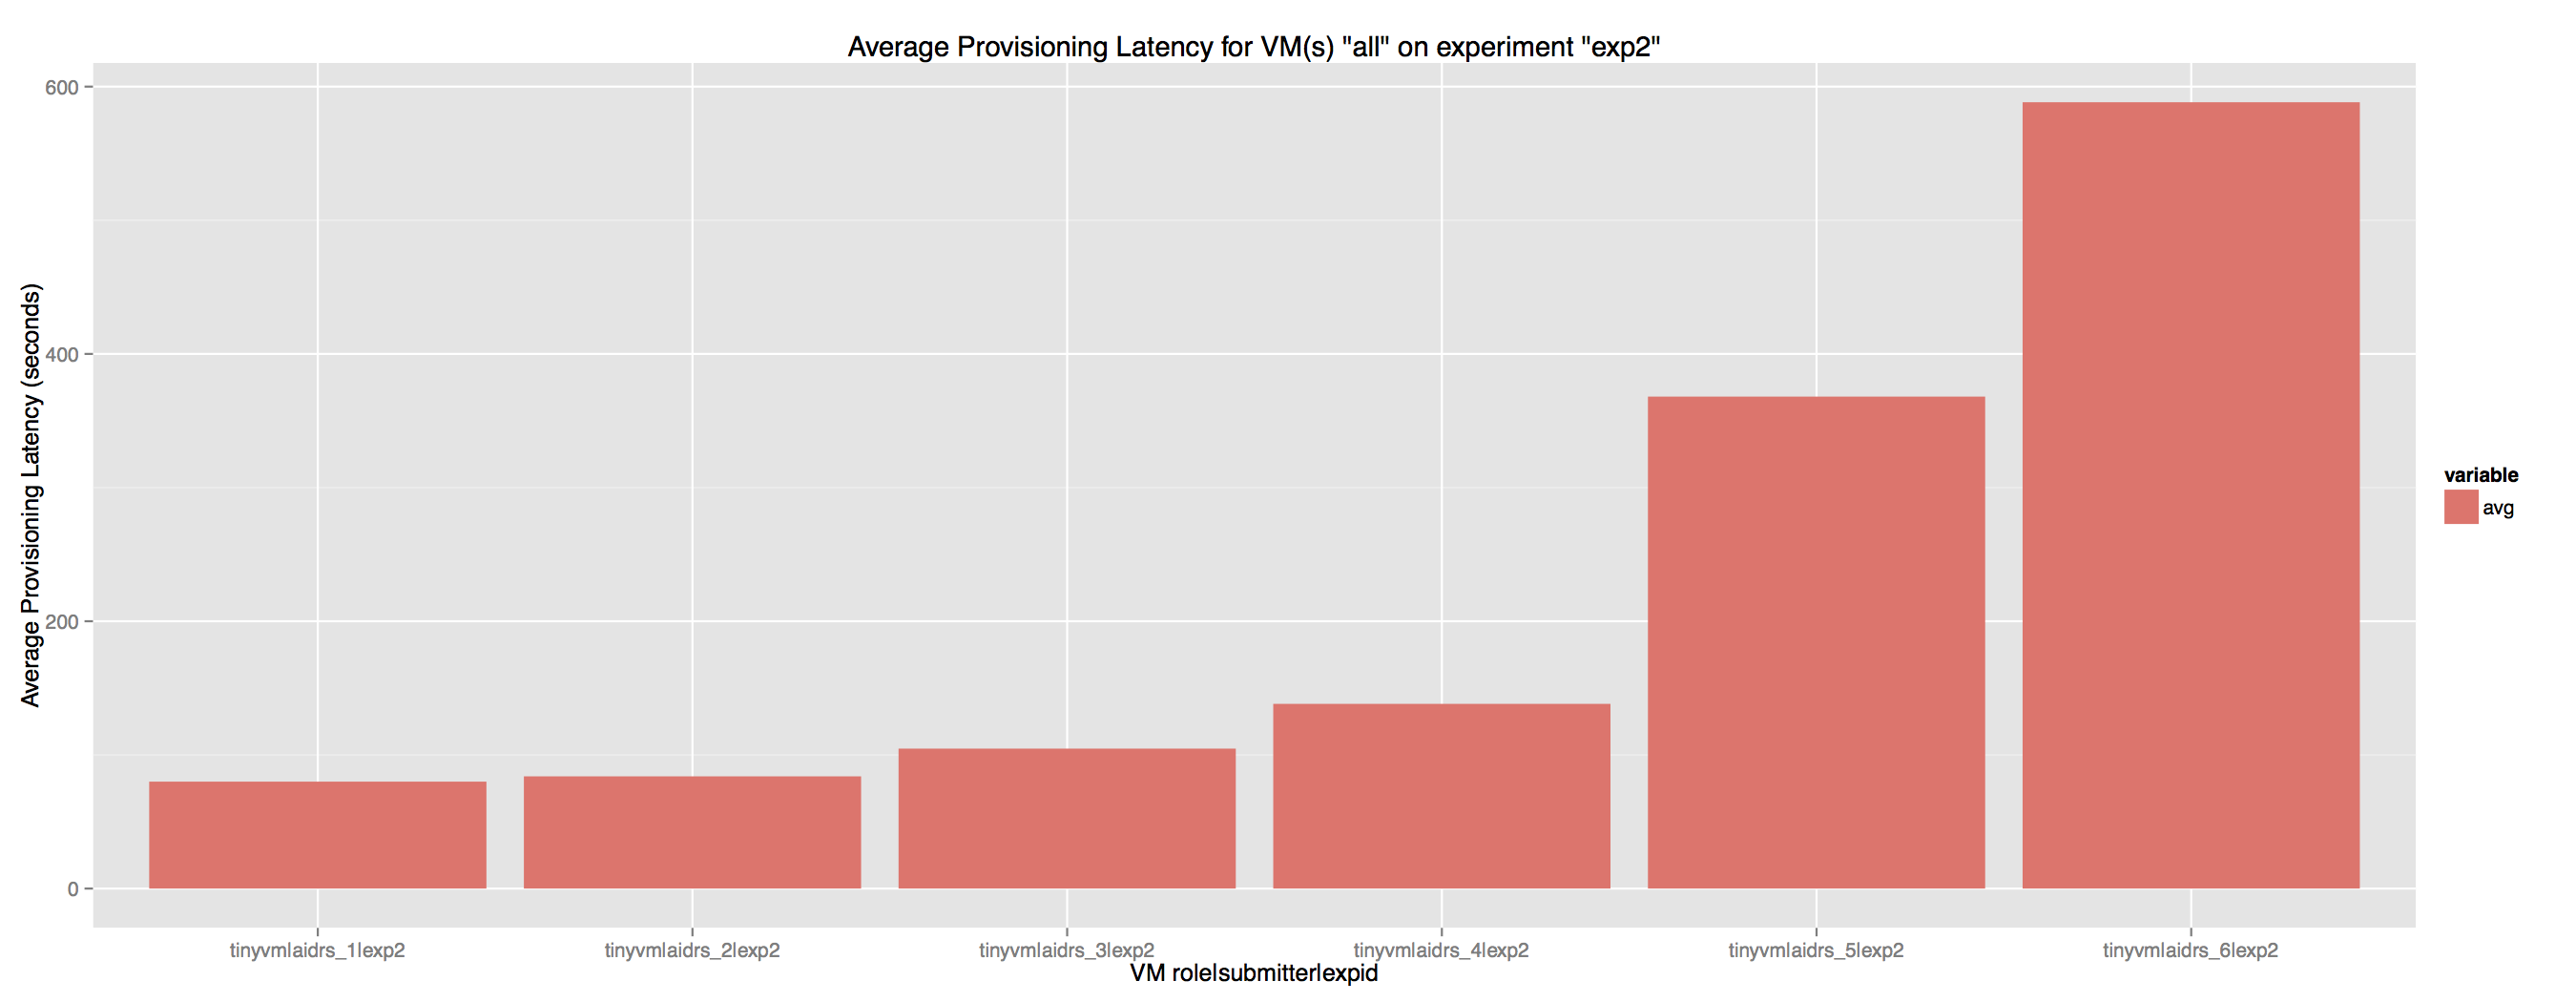
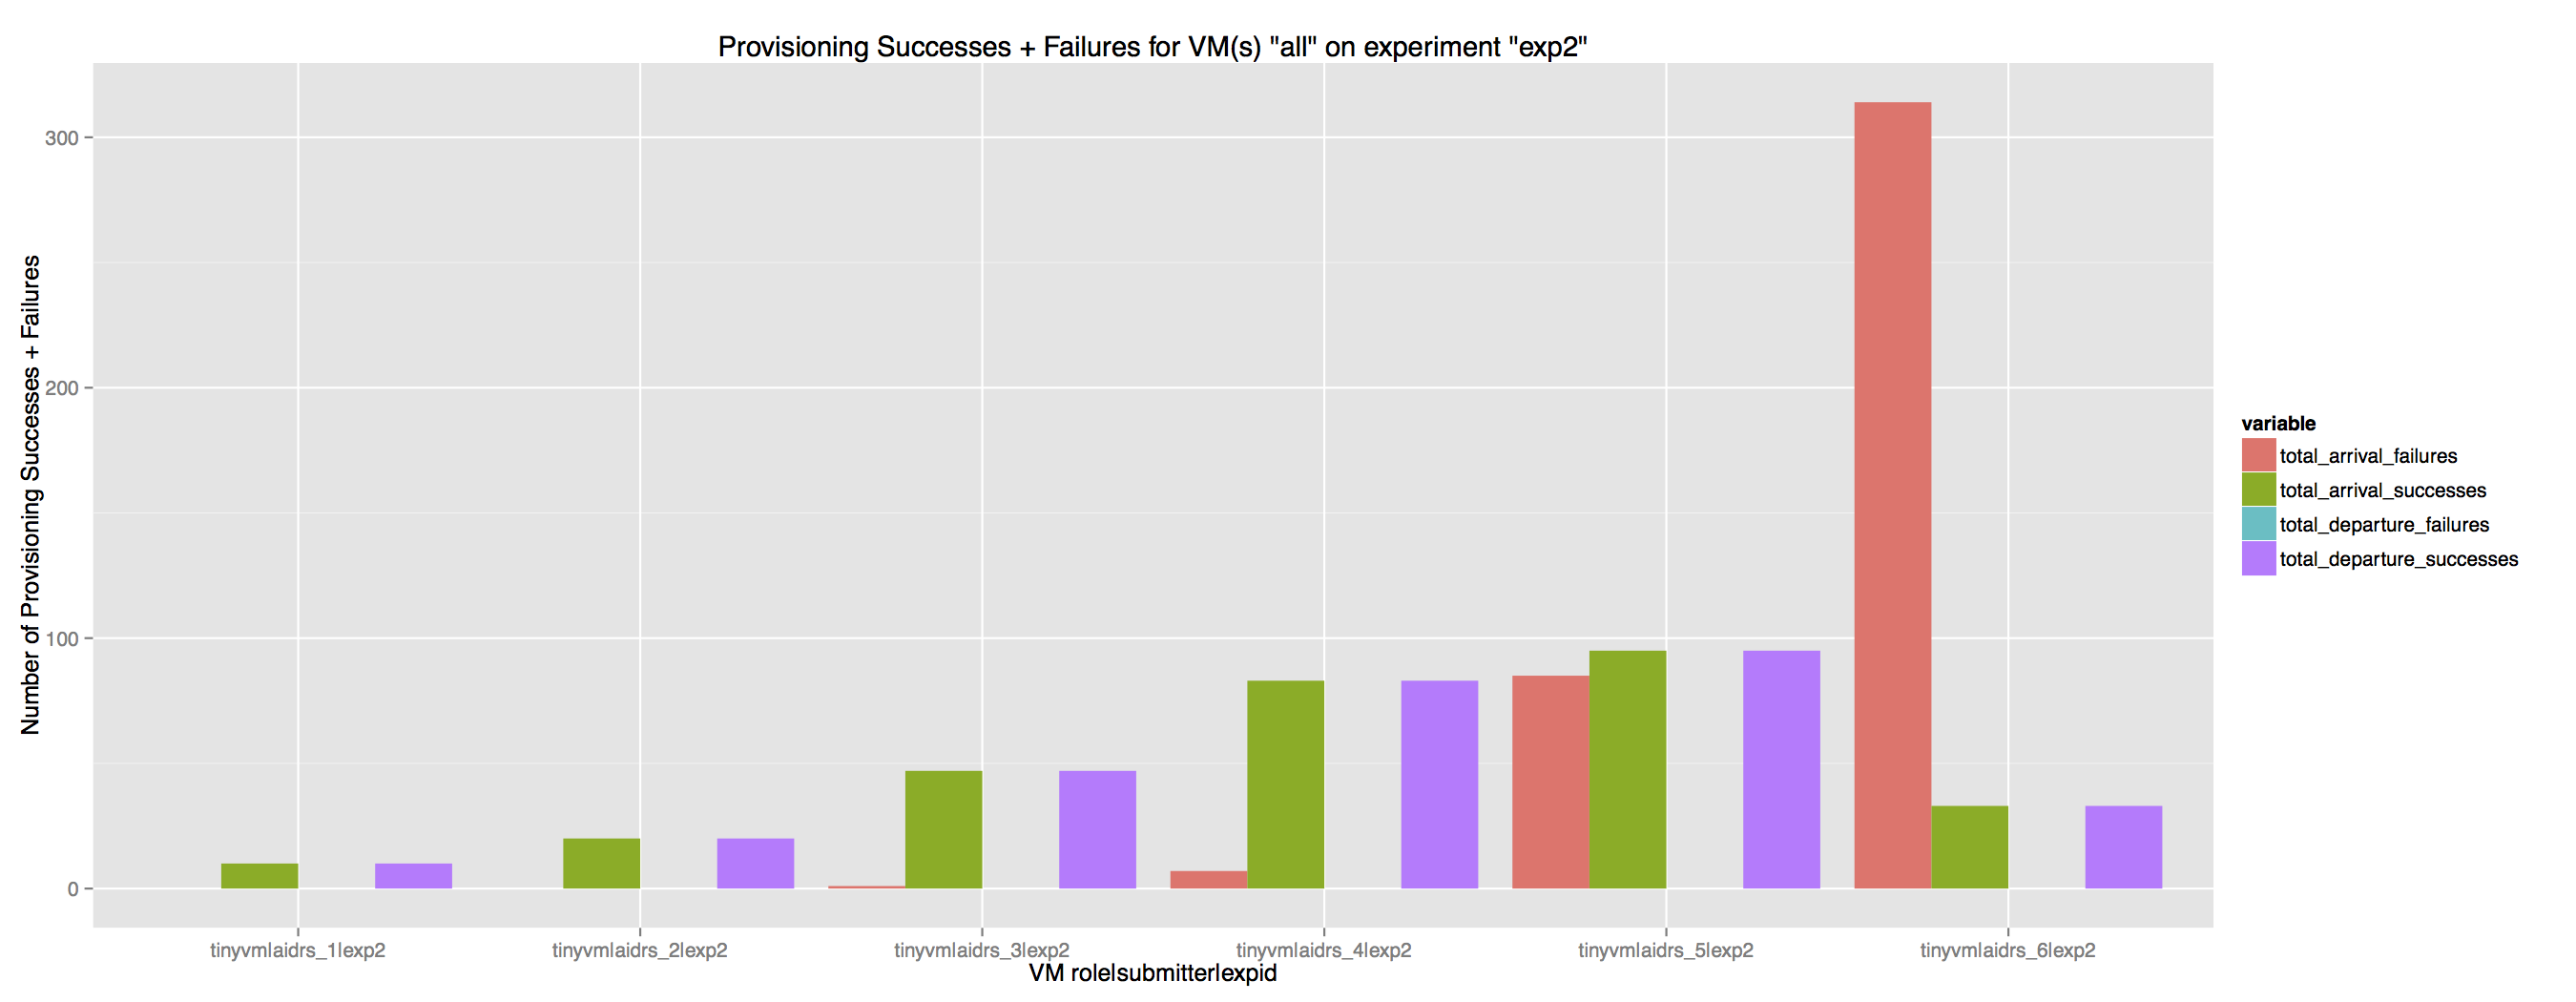
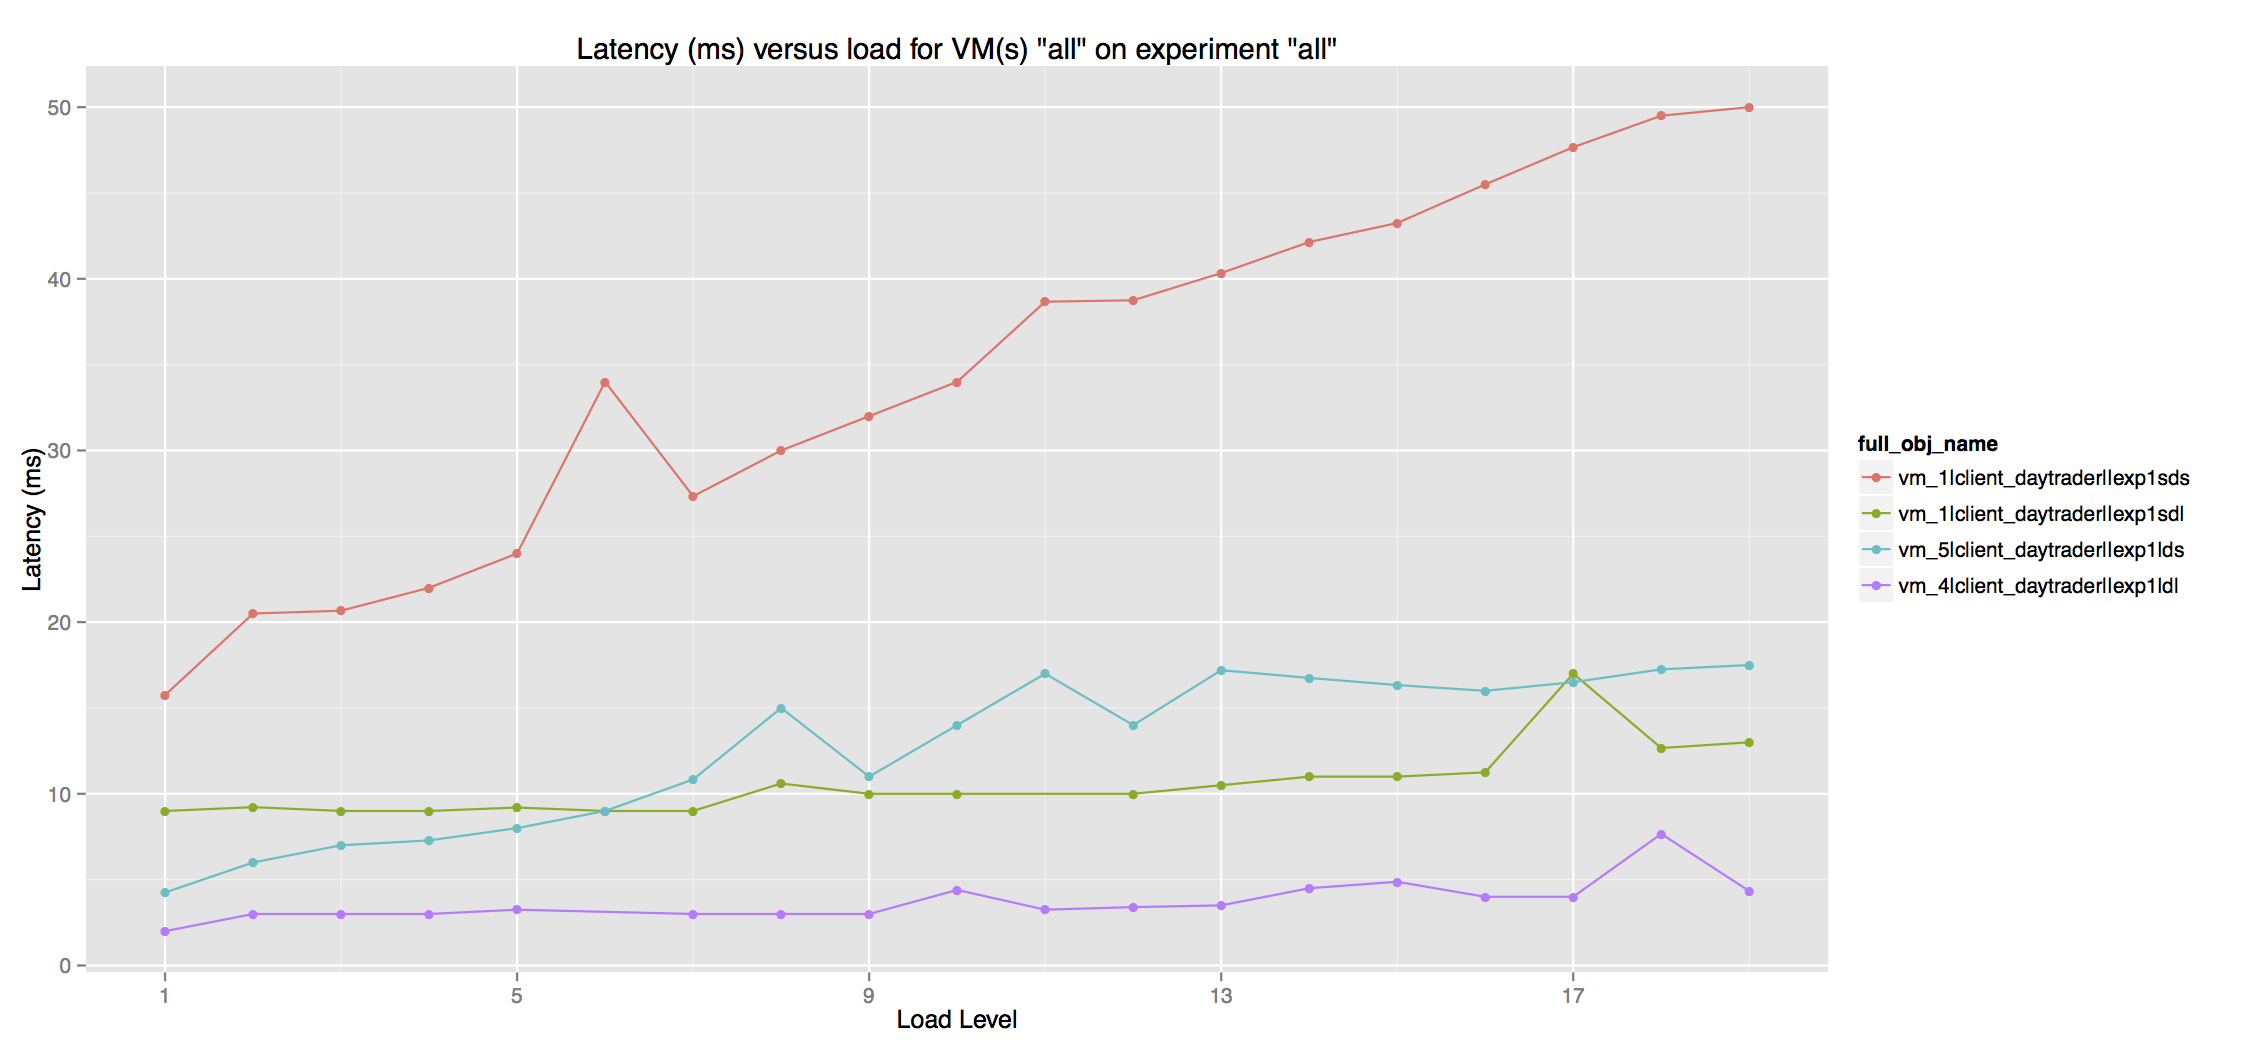
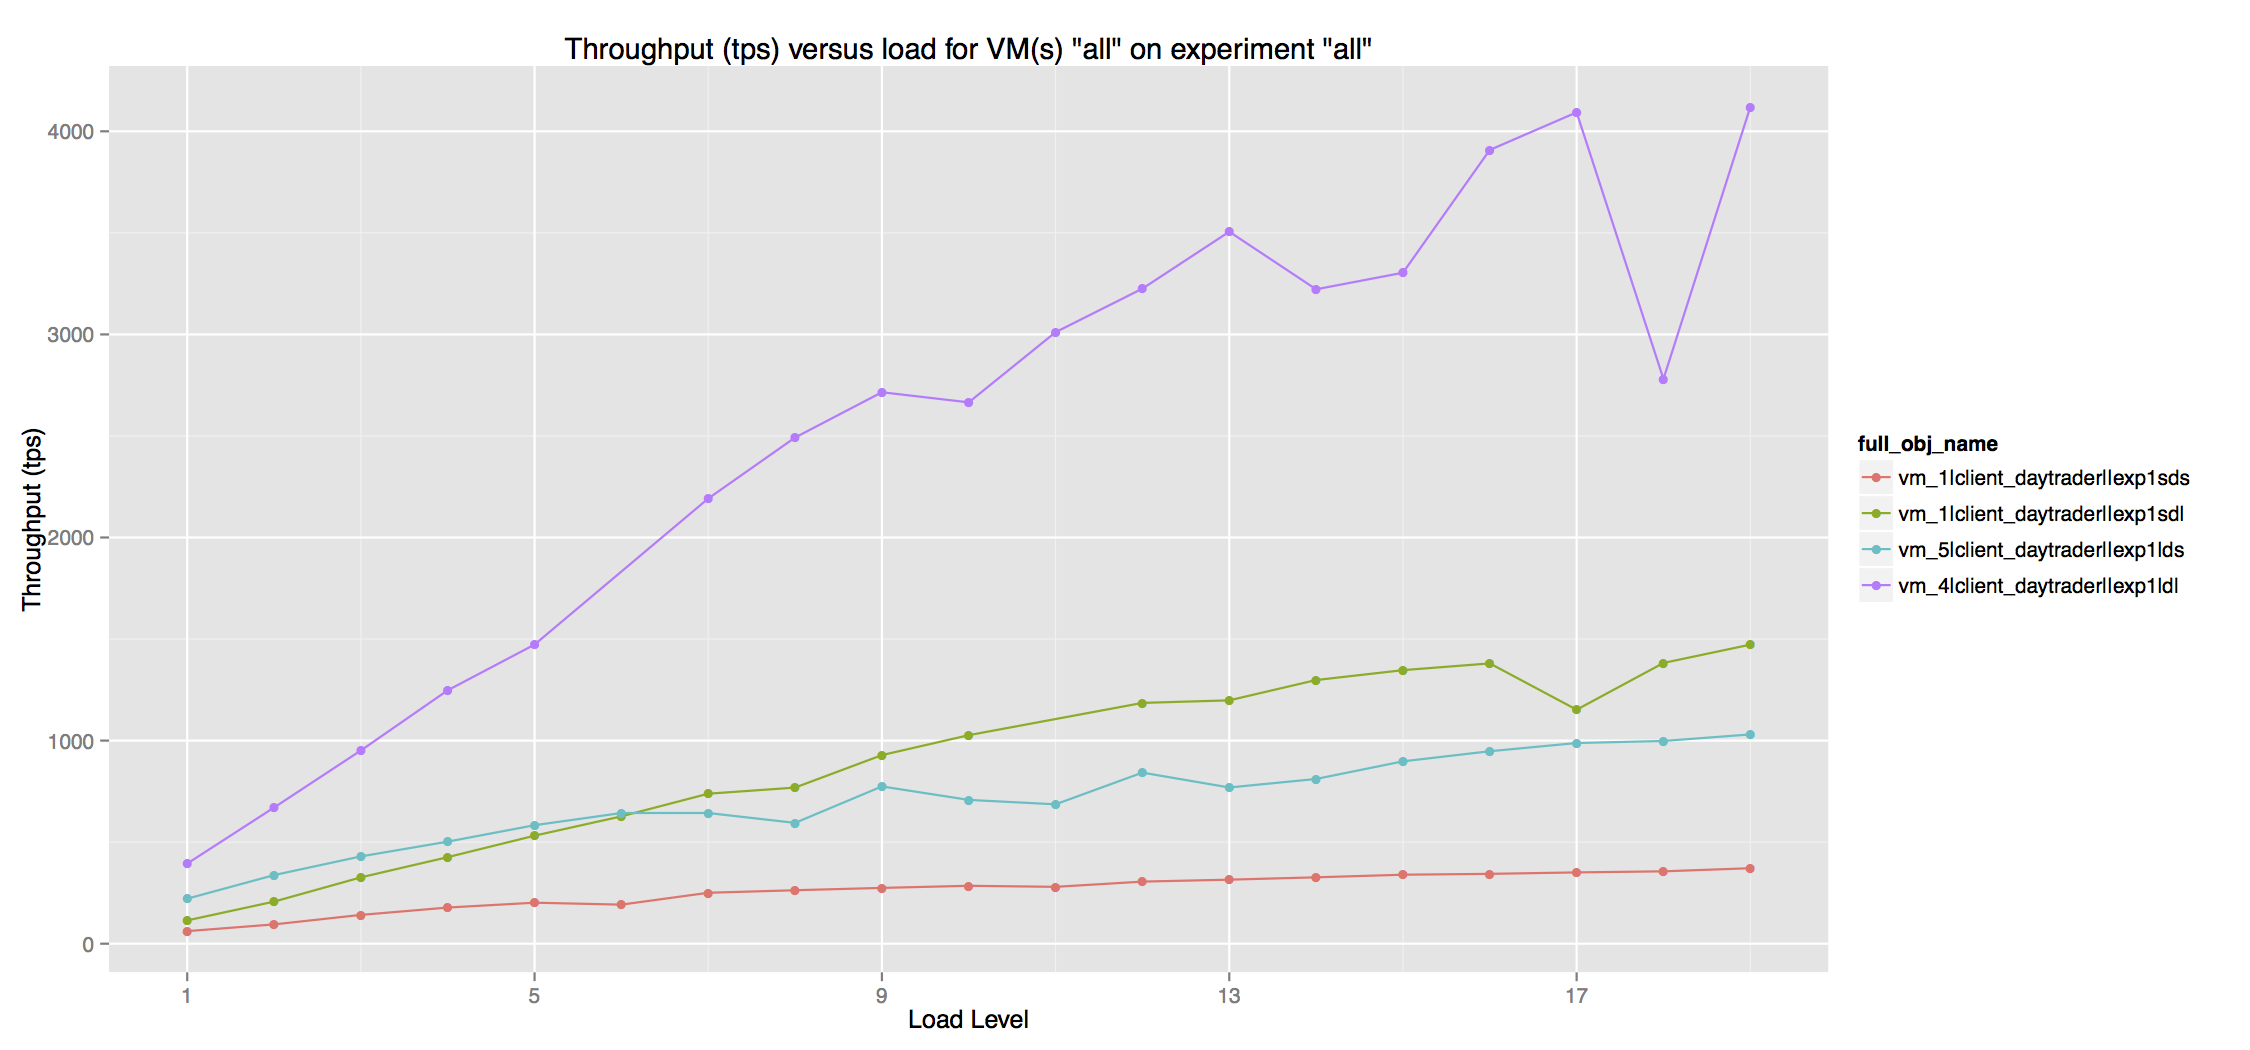
This second and third plots were generated as part of the Experiment 2
-
VM_runtime_app_<experiment id>.csv: contains information regarding the application performance, such as latency, throughput and bandwidth, all generated directly from the VM.
These plots were generated as part of the [Experiment 4] (https://github.com/maugustosilva/cbtool/wiki/HOWTO:-Run-simple-experiments)
These plots were generated as part of the [Experiment 3] (https://github.com/maugustosilva/cbtool/wiki/HOWTO:-Run-simple-experiments)
-
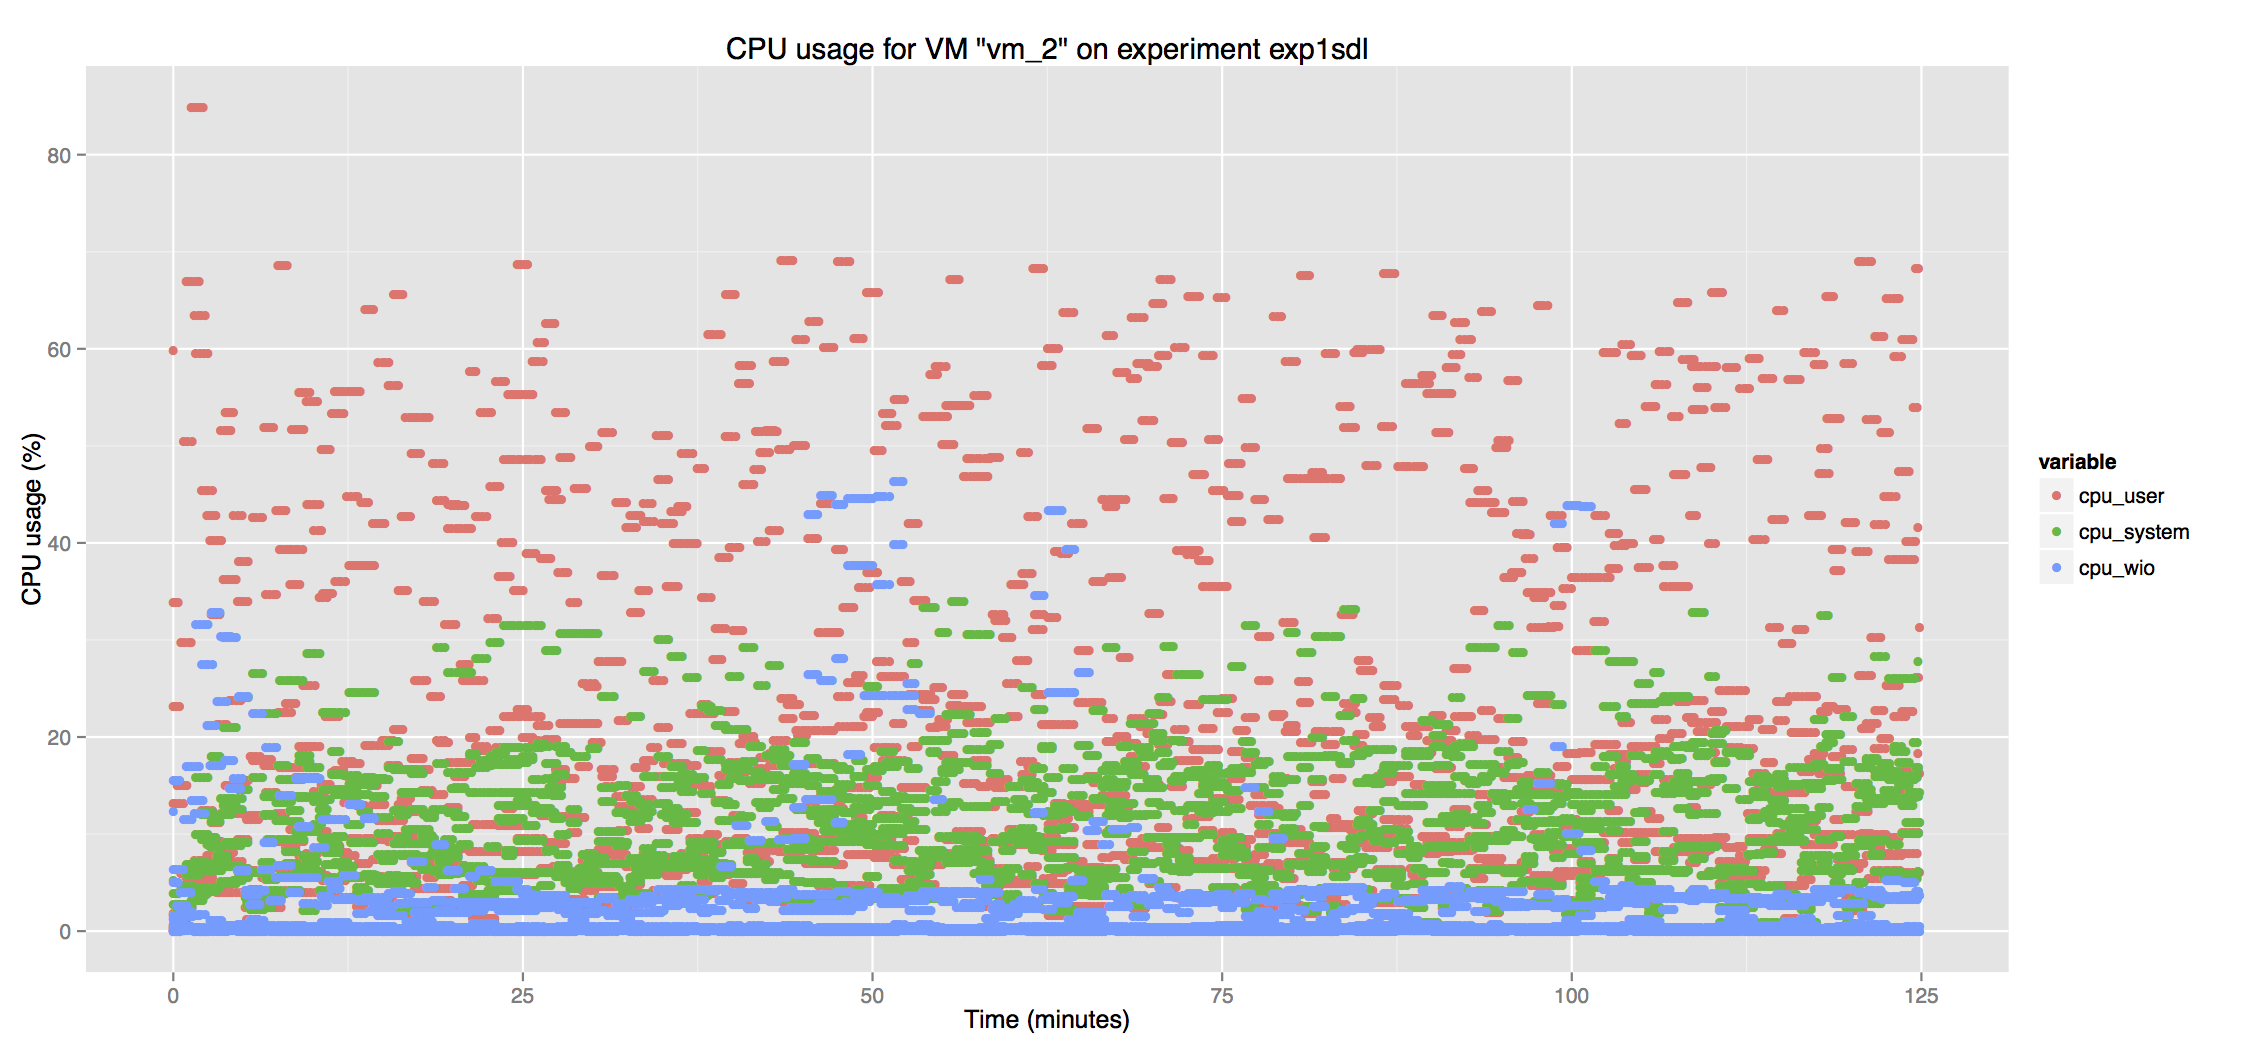
VM_runtime_os_<experiment id>.csv: contains OS metrics (CPU, memory, disk I/O, network I/O) all generated by the VM.
-
HOST_runtime_os_<experiment id>.csv: contains OS metrics (CPU, memory, disk I/O, network I/O) all generated by the HOSTS. It can only be used on Clouds where there is direct access to the hosts (this means that this data cannot be collected on EC2, for instance), and where the Ganglia monitoring tool was manually configured on the hosts.
Again, the small script located in ~/cbtool/util/plot/cbplogen.R, written in the R language, can be used to quickly and automatically produce plots using the data supplied by the csv files. In order to use it, you need a relative recent version of R (2.X) with the following libraries installed: stringr, reshape2, ggplot2, data.table, optparse, hash. To see the script's help, just run it with "--help" option.
These commands (monextract) and the script (cbplotgen.R) are provided just for convenience. The same performance data can be accessed directly from the "Metric Store" (MongoDB), through a native client/driver.